|

These schemas are copies from original
hand-written data derived test runs of kiha 391 on Hakubi, Sanyo lines
in 1972 to 1973.
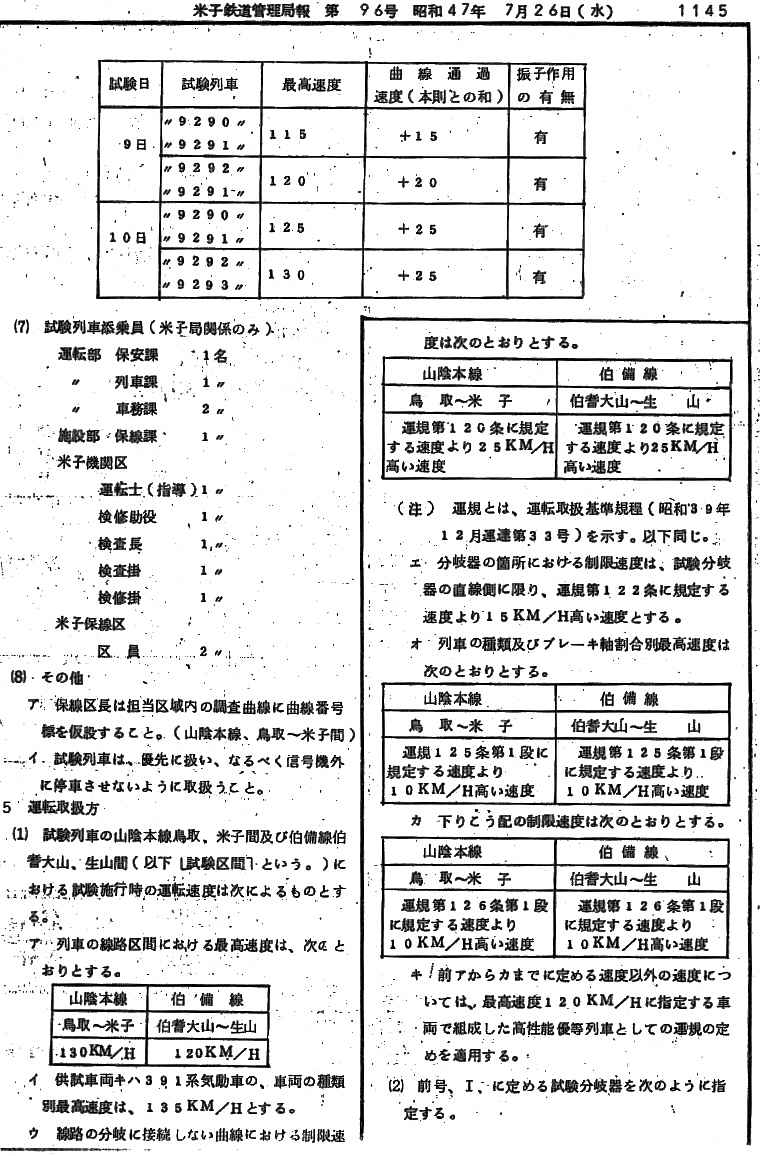
Tractive effort
(actual measurement)
 Each
plot shows the relation between the speed and tractive effort by each
notch. Solid straight lines are the planned theoretical tractive effort. Each
plot shows the relation between the speed and tractive effort by each
notch. Solid straight lines are the planned theoretical tractive effort.
The measured efforts are higher than planned
except for the full notch-7. The starting effort at notch
position 1 or 2 is too weak to overcome the starting resistance so the
train could not start. To reduce the friction loss of the transmission,
the hydraulic jack was equipped to the reduction gear box. This system
increased the tractive effort at low notch. At notch position-4, 250 kg
improvement was shown on this schema.
At notch position-7, derived tractive effort
was somewhat lower than planned.
Probably this might have been caused by the high temperature (nearly 30
degrees Celsius).
Engine output usually changes according to
the ambient temperature. The rated output usually shown is the output at
the temperature of 15 degrees Celsius. The output of a simple cycle gas
turbine decreases when the absorbing air temperature rises.
|
|
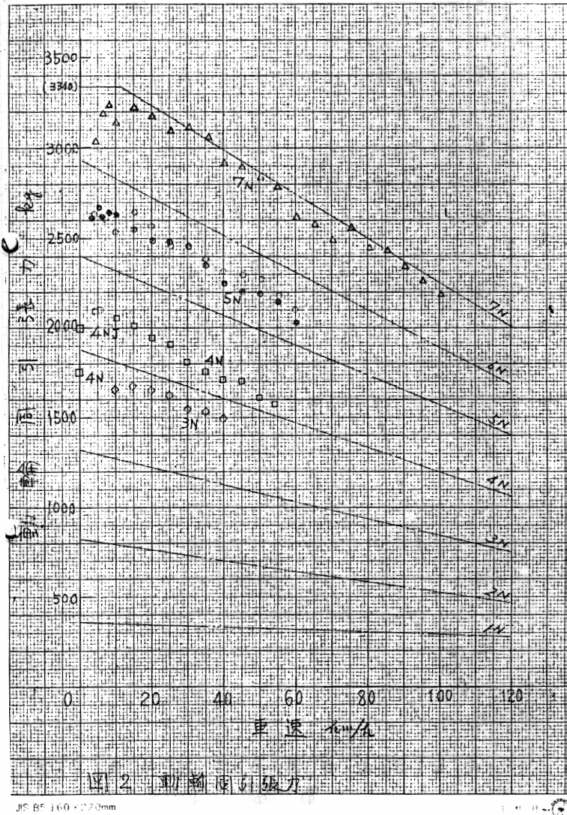
 Fuel
consumption Fuel
consumption
The right graph shows the relation between the speed and
fuel consumption ratio by each
notch. Y-axis unit If a plot goes in the upper area of Y-axis, it means
the fuel consumption is bad.Unit of the Y-axis is g/PS・h.
If a 1000 hourse power engine's fuel consumption ratio is 300 g/PS・h,
300 kg fuels are consumed in one hour.
The fuel consumption worsens at low notch positions and low speeds. This
feature is especially specific to a single speed direct drive gas
turbine car.
|
Acceleration test
This list shows the actual measurement
of the acceleration test. The used notch position was 6, not full notch
position. (Full position is 7.)
The start-up characteristic is very bad, it took about 11 to 15 seconds
(in this case 12 seconds) to rise the power turbine torque and start the train. A poor response of
a gas turbine is well known, but this value is too large. After the
engine control unit was improved, the lag time was shortened to 4
seconds and this is the acceptable lag time in the train operation
planning.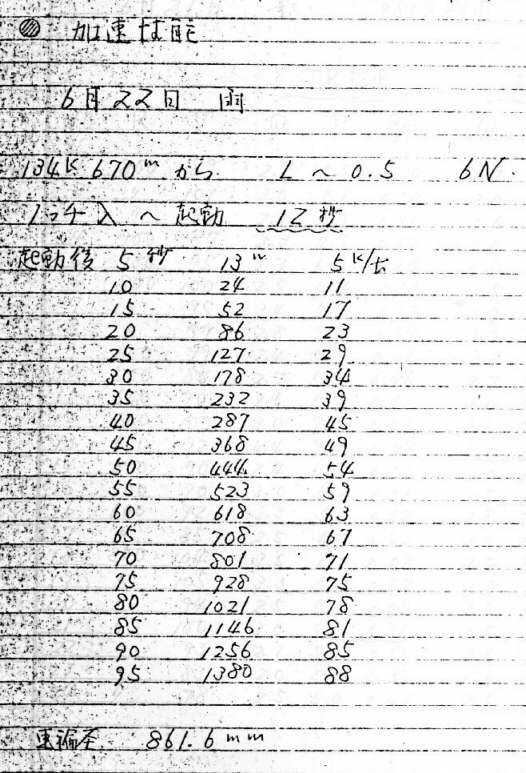
The train reached the speed of 63 km/h 60
seconds after starting, 85km/h 90seconds after starting. This was not
bad performance in comparison to DMUs in those days. But series 181
DMU "Tsubasa", consisted of 11 motive
car and 1 trailer could reach the speed of 73 km/h 60 seconds after
starting, 91km/h 90seconds after starting and the performance of kiha
391 was somewhat unsatisfactory.
There are different points of view. If the initial speed is set to 45
km/h, this speed was the speed limit to pass through turnouts usually
used in local main lines, the time required to reach the speed of 95
km/h (top operating speed in these lines) is 60 second at notch
position 6. It took 66 seconds by series 181 at full notch position.
This means the low acceleration performance of the single speed direct
drive turbine railcar at lows speed and comparably good performance at
middle to high speed. A turbine test driver, who was also the driver of
series 181 "Yakumo" stated his impression that the turbine had
a better acceleration than series 181 after it got some speed.
If kiha 391 starts with notch position 7, it
has better performance, of course.
Computer simulations shows this clearly, at the rated output is set to
1050 horse power (same as kiha 391 7 notch position), this train reaches
the speed of 73 km/h 60 seconds after starting, 99 km/h 90seconds after
starting. If the output is set to 1250 horse power, 30 minutes rating,
each reached speed is 85 km/h and 112 km/h, far more faster than DMUs in
those days.
|
|
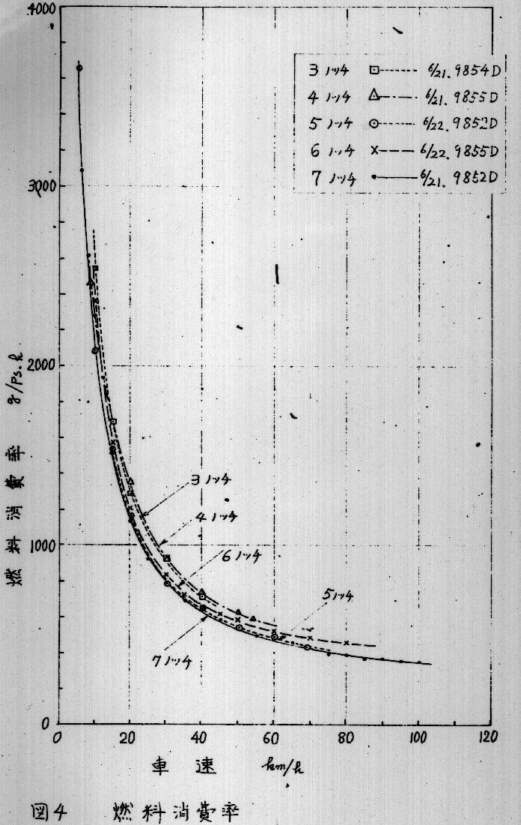
Running curves
These are running curves drawn for
test runs between Seto to Higashiokayama, outbound Sanyo line in 1972.
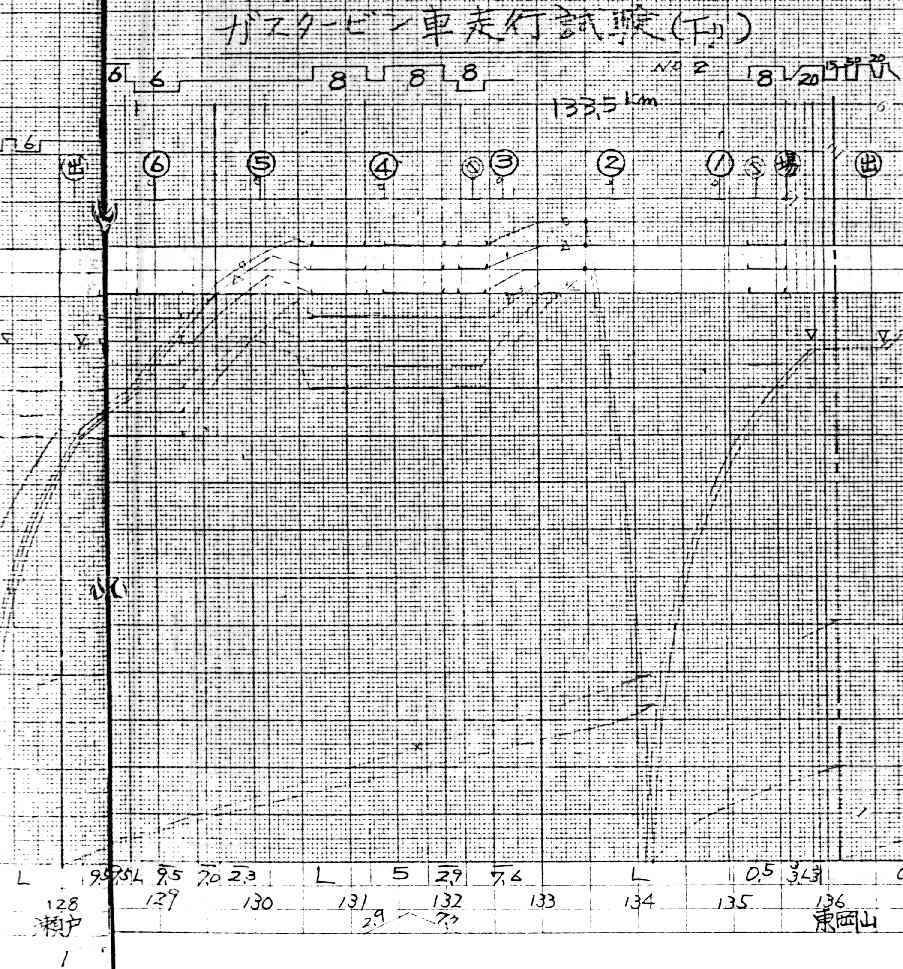
ちょうど中央付近でR800mの曲線がいくつかあり、それの通過制限を105km/hから130km/hまで変えているのがわかります。しかも最高速度は135km/hまで計画していたようです。120km/h以上の目盛りが途切れていますが、当時の作図用紙は120km/hまでしか対応していないからです。140km/hからまた目盛りが出ていますがこれは上り列車の作図用の欄なのです。391のランカーブはここまではみ出して作図されたのです。
東岡山の手前で高速から一気に600mほどで急停車していますが、ここで非常ブレーキ試験が行われたようです。
|